
Imperas is now a part of Synopsys
Overview
The focus of the Imperas products is to save engineering time in the development of embedded software, primarily achieved by making the engineering process significantly more efficient through the use of high-performance simulation and automated, powerful tooling.
The Imperas Multicore Software Development Kit (M*SDK) is a complete embedded software development environment that operates using virtual platforms and is specifically designed to handle complex multicore related issues. M*SDK contains all the capabilities of the M*DEV product, together with a comprehensive verification, analysis, and profiling (VAP) tool set, plus an advanced 3-dimensional (temporal, spatial and abstraction) debug solution, named 3Debug™, for heterogeneous multicore processor, peripheral, and embedded software debug.
Both the Verification, Analysis and Profiling (VAP) tools, as well as the 3Debug environment contain a range of highly advanced capabilities to handle unusual problems while also enhancing embedded code for multicore designs and complex processor platforms. Custom capability may be easily created to handle specific scenarios. The system uses advanced technology to improve the performance and reliability of the solution, eliminating wasted hours of unnecessary engineering effort.
M*DEV - Multicore Developer
M*SDK includes all the functionality and is a superset of the M*DEV product.
M*DEV includes all the platform and peripheral model development technology and high-performance simulation system, using this as a basis for the software development kit components. The M*DEV product is described here.
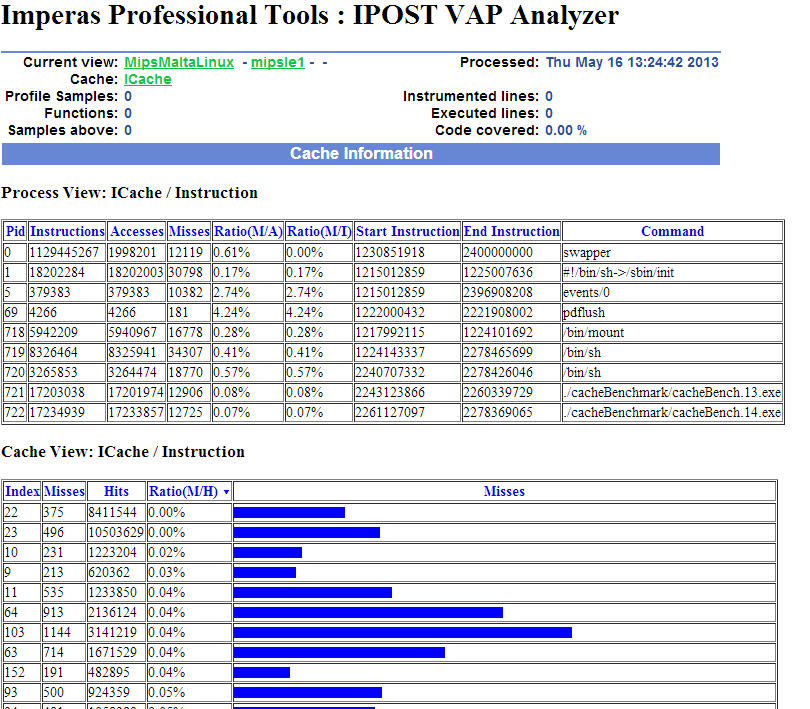
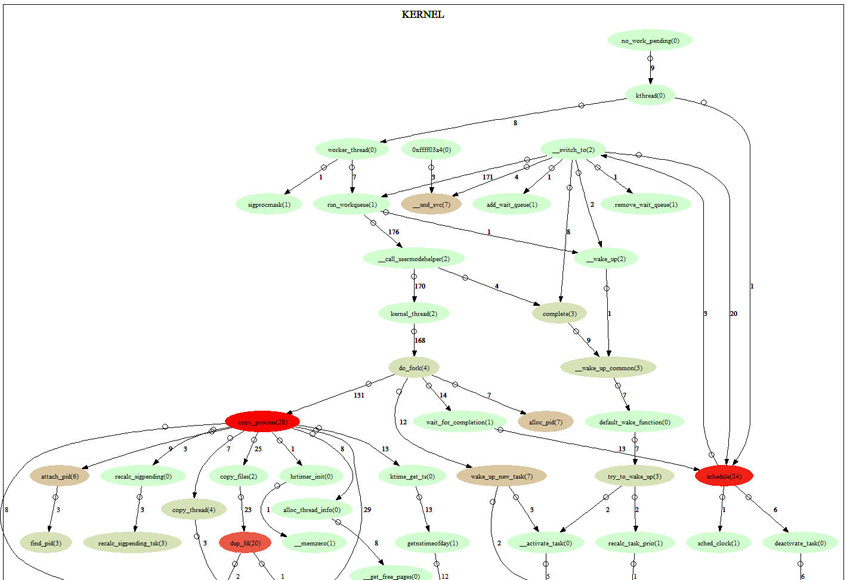
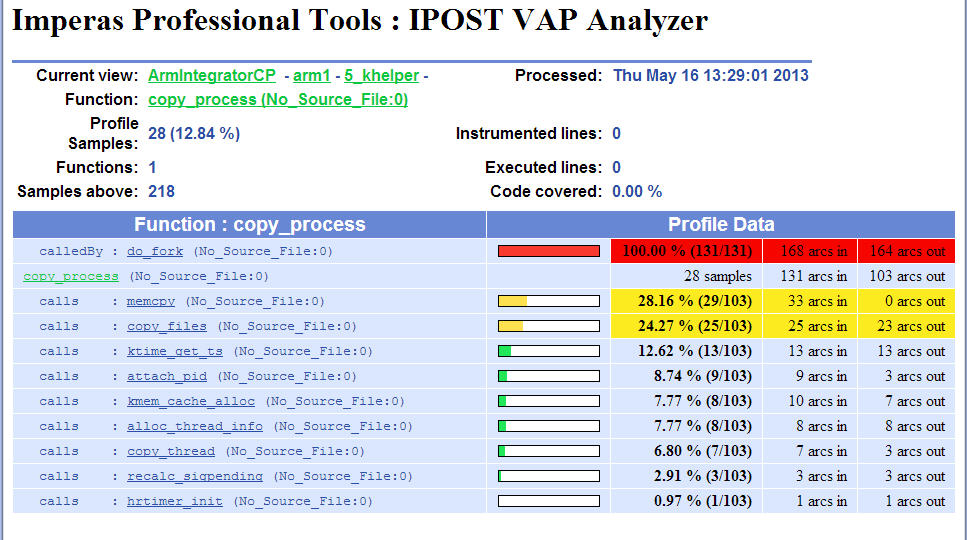
Verification, Analysis and Profiling (VAP)
The Imperas Multicore Software Development Kit M*SDK™ includes Verification, Analysis and Profiling (VAP) capabilities for systems running single and multicore embedded software. The Imperas M*SDK boasts a number of unique capabilities designed to improve the quality of the final code base in terms of bug elimination and execution performance, as well as reduce the engineering time required to achieve that quality.
 |
 |
 |
 |
 |
 |
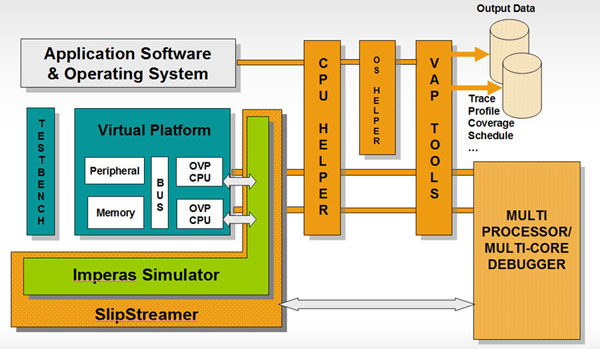
As well as providing a complete user accessible range of standard technology to implement the VAP functionality, the system has been extended with unique capabilities that increase the speed and accuracy of code analysis and profiling. These provided capabilities, known as VAP tools aid in the streamlining of software execution and the optimal use of multi-core processor architectures. The system is also CPU- and OS-aware, allowing different operations based on the system state.
Advanced VAP Tool capability in the M*SDK include the following:
|
|
The system uses all the facets of the virtual platform approach and its power over a hardware prototype, for example, the ability to inspect deeply embedded signals and the rapid inspection of shared memory and key registers. In addition, Imperas technology is able to use ToolMorphing™ to 'merge' the debugger operations with the simulator operation so it underneath the embedded software allowing, for example instrumentation free coverage and profiling, and variable and memory inspection dynamically without embedded software code modification or interaction, thus improving accuracy.
Another unique facet of the system is the ability to enable custom features to target company- or even project-specific profiling, analysis, and verification requirements. For example, specialized communication testing functions between cores in multicore devices, targeting memory location tracing, specific code analysis routines, and many other custom capabilities may be created using a specialized API that provides access to internal simulation and environment features.
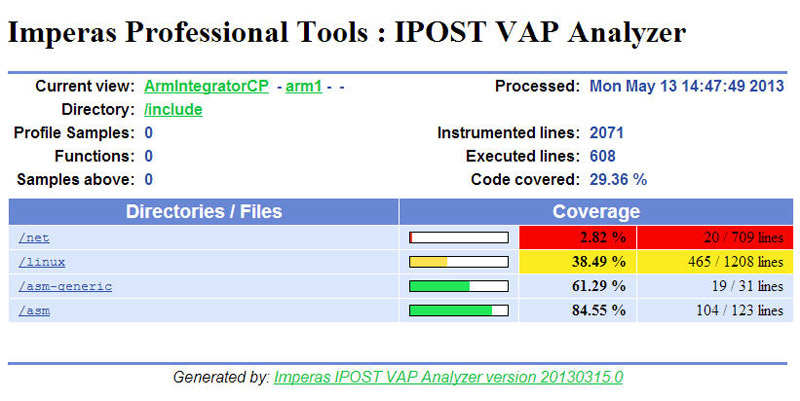
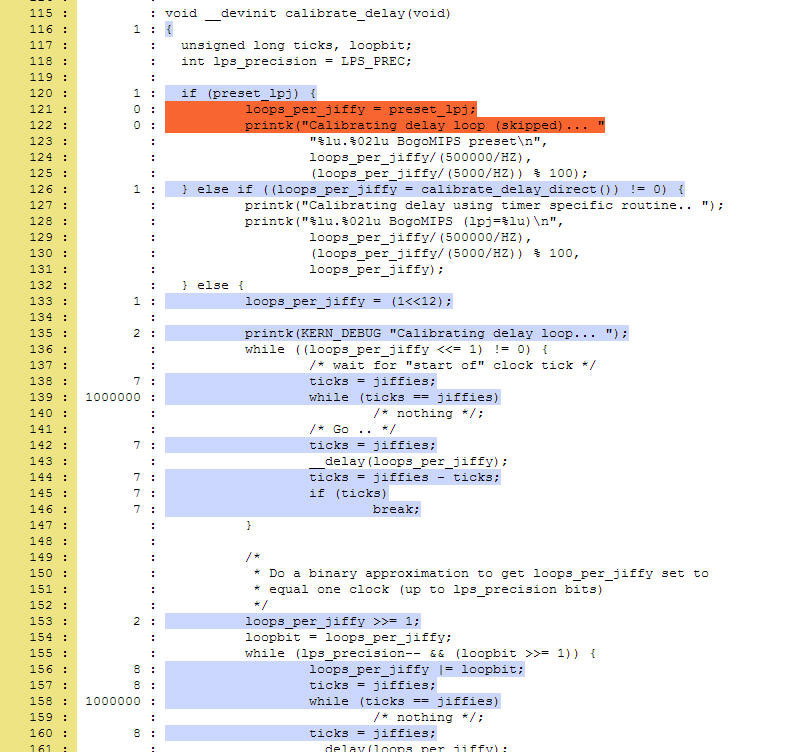
The verification aspect of the tools is enhanced with a range of controllability and observability functions. Powerful test scenarios may be applied that leverage exceptions created through various means including assertions operating separately to the embedded code, applying programmed scenarios based on multicore processor interactions. It is this level of capability that is easily leveraged on top of more traditional test sets that can be used to ensure correct operation in all circumstances. This is augmented with a range of coverage options working at varied levels of abstraction to ensure that the entire code base has been fully exercised.
The Imperas ToolMorphing™ technology is used to generate code for the sections of the software design kit required for VAP functions called at specific moments. By tying the simulation code generation process with that of the software design kit, inefficiencies inherent in other tool architectures are eliminated, improving the performance of the entire Imperas solution.
In many tool suites, either an apparent bug can be seen to disappear when a debug environment is applied, or a “fake” bug appear when code is run under a debugger (these are often known as Hiesenbugs). The SlipStreamer™ technology, also executed within the code generation process, separates the embedded software under simulation from underlying system code generation, thus ensuring that code-under-test execution is not affected by the tooling processes, and vice versa. This avoids the time consuming problem of tracking down a bug that is not present, or finding one that hides during debugging.
The Imperas M*SDK represents the state-of-the-art in terms of embedded software development technology, and has been proven to shave many days off intensive engineering effort, thus reducing engineering schedules at critical times during the development process.
Advanced Software Debug using 3Debug
M*SDK includes a powerful three-dimensional debug solution (Temporal, Spatial, Abstract), named 3Debug™, that provides a range of capabilities over and above standard single core debuggers, such as the GNU Debugger (GDB). The M*SDK debug solution has been specifically designed to deal with the issues surrounding multicore processor debug.
3Debug operates in a familiar, GDB-like, manner and allows the processing of standard GDB commands. It also leverages a TCL input mode, which provides extended scripting capability. TCL scripts may be attached to execution activity in the platform, allowing complex debug operations to be executed based on a sequence of events. The system makes use of user and programmer view modes, allowing ideal use models to be leveraged for platform developers, embedded code developers, or maintenance engineers.
In a multicore scenario 3Debug can be made to focus on specific processors or operate across entire platforms allowing for the debug of all processors and peripheral activity. It can control the specific execution of named processors, freeze all or parts of the platform, and synchronize debugging to particularly execution points across the system. The ability to observe critical signals at important points in time is also improved, for example, watching classic areas of interaction such as shared memory locations which can create many issues during the multicore debug process. Programmable watch scenarios make analyzing memory usage and looking for corrupted locations straightforward.
The 3Debug debugger operates in three dimensions:
- Spatial. Provides access across the platform’s multicore components. Trace, debug, analyse, verify etc., software running on any or all processors or cores in the platform at the same time as debugging code modeling OVP peripherals.
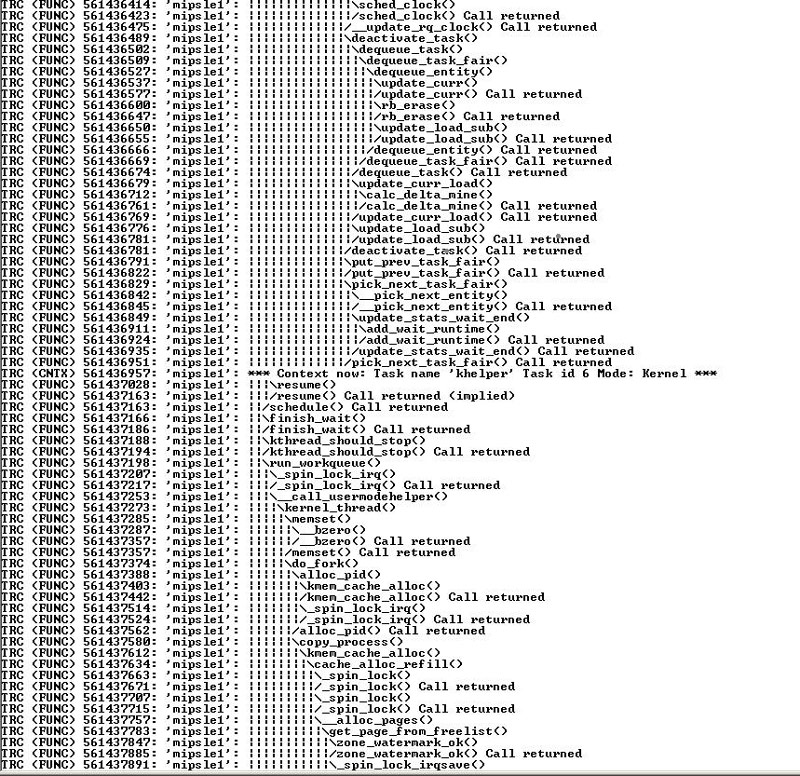
- Temporal. Monitor and trace events and activity occurring in the system over time creating time ordered complex sequential breakpoints and temporal assertions, while applying unique control to code scheduling on different cores.
- Abstract. By creating abstractions of activity occurring in the system, debugging, analysis, verification etc can focus on high level events and operation of the system. For example the built in CPU-awareness and Operating System-awareness provide abstractions allowing such things as simulated OS scheduler tracing, breakpoints on simulated OS task context switch etc.
This level of debug awareness coupled with the programmable nature of the tool makes this debug environment immensely powerful, which leads to extremely efficient debug operations.

3Debug makes use of the CPU- and OS-aware operational nature (capability to understand and control operating system execution) and has been used to discover and repair complex bug conditions. In one example, a large semiconductor company had been operating a modified version of Linux within delivered products. Using 3Debug, engineers found a rare, but critical, fault condition resulting from overwritten memory locations in an unusual scenario. OS Aware control-ability was used to trap the fault condition, which had not been discovered using regular debug systems even after many hours of testing on hardware prototypes and other virtual platform systems.
3Debug sets a new standard for multicore debugging and has been proven on real designs to locate fault conditions inaccessible to other debug solutions. Its ease of use, execution reliability, and operational efficiency make it an excellent choice for multicore embedded software development.
Related News & Press
Related Articles
Related Industry Events
Related Resources
There are many Imperas documents available. Some of them are accessed only from the Imperas User site and are available only to Imperas customers under license.
On the OVPworld website there are many documents that introduce the various APIs and technologies developed by Imperas and made available as part of Open Virtual Platforms. Click here for the OVPworld documentation list.
Publicly available Imperas documents:

Comments
Itai Yarom, VP of Sales and Marketing
MIPS, Inc.The eVocore P8700 Multiprocessor is our first RISC-V based IP core.
As an open standard ISA, RISC-V provides a foundation for a basic level of compatibility across technologies in the ecosystem. Together with Imperas and Ashling we are going beyond that, enabling SoC designers and software developers to take advantage of the P8700’s advanced microarchitectural features using best-in-class models and tools.
Allen Baum, Chair of RISC-V Foundation Technical Committee Task Group for Compliance
Esperanto Technologies, Inc.The work of the RISC-V Compliance Task Group is vital to the success of RISC-V and anyone trying to design or sell RISC-V based products. We welcome the contributions of Imperas and believe that using riscvOVPsim as one of the reference simulators could be highly valuable in the overall compliance effort.